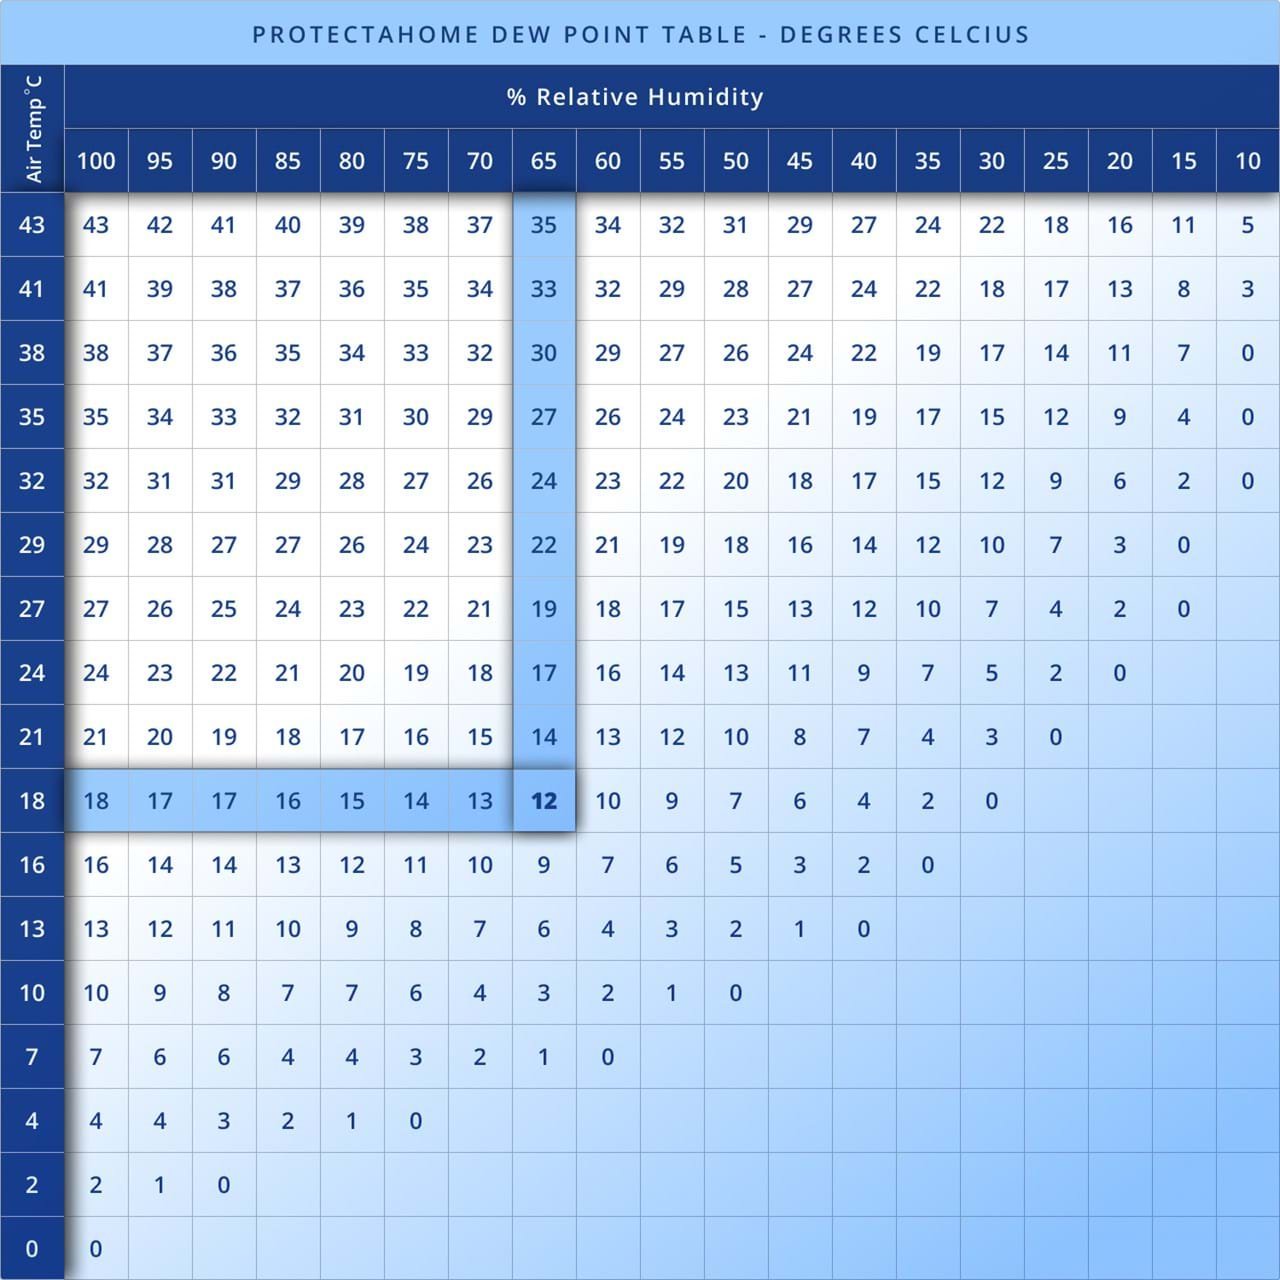
Humidity is a fundamental concept in weather science and everyday comfort. It impacts how we feel, how our homes function, and how nature behaves. However, understanding humidity can sometimes be complex. This is where a dew point chart comes in handy. By decoding humidity through the use of a dew point chart, you can gain valuable insights into weather conditions and their effects on your environment. Let’s explore how a dew point chart works, why it’s useful, and how you can use it effectively.
What is Humidity?
Humidity refers to the amount of water vapor present in the air. It’s a key component of the water cycle and plays a crucial role in weather phenomena. Humidity is typically expressed in two ways:
- Relative Humidity (RH): The percentage of moisture in the air compared to the maximum amount the air can hold at a given temperature.
- Absolute Humidity: The actual mass of water vapor per volume of air, expressed in grams per cubic meter.
While relative humidity is the more commonly discussed metric, the dew point provides a more precise understanding of how humidity feels.
Understanding the Dew Point
The dew point is the temperature at which air becomes saturated with moisture, leading to condensation. For example, when the air temperature cools to the dew point, dew, fog, or frost forms. The dew point is a direct indicator of atmospheric moisture content.
- High Dew Point: Indicates high humidity levels and can feel sticky or uncomfortable.
- Low Dew Point: Suggests dry air, often associated with cooler or arid conditions.
The dew point remains constant unless the moisture content in the air changes, making it a reliable metric for gauging humidity.
Why Use a Dew Point Chart?
A dew point chart is a visual representation that helps decode the relationship between temperature, relative humidity, and dew point. This chart can be used in various fields, such as meteorology, HVAC systems, agriculture, and even personal health.
Here are some benefits of using a dew point chart:
Weather Prediction: Helps forecasters understand when dew, frost, or fog might form.
Comfort Assessment: Identifies conditions where humidity might feel oppressive or pleasant.
Industrial Applications: Ensures optimal humidity levels for storage or manufacturing.
Agricultural Planning: Guides irrigation and pest control decisions based on moisture levels.
How to Read a Dew Point Chart
A typical dew point chart consists of three axes:
Air Temperature: Usually represented in degrees Fahrenheit (°F) or Celsius (°C).
Relative Humidity (RH): Expressed as a percentage.
Dew Point Temperature: Shown as the resulting value after cross-referencing air temperature and relative humidity.
To use the chart:
Locate the air temperature on the horizontal axis.
Find the relative humidity percentage on the vertical axis.
Trace both points to their intersection, which will give you the dew point temperature.
Dew Point and Human Comfort
The dew point significantly affects how humans perceive comfort. Here’s a general guideline to interpret dew point readings:
- Below 50°F (10°C): Comfortable and dry.
- 50°F – 59°F (10°C – 15°C): Slightly humid but still comfortable.
- 60°F – 69°F (15°C – 20°C): Noticeably humid, may feel muggy.
- Above 70°F (20°C): Very humid and potentially oppressive.
Applications of Dew Point in Everyday Life
Weather Forecasting
Meteorologists rely on dew point readings to predict phenomena such as thunderstorms, fog, and frost. A high dew point often signals unstable weather conditions.
HVAC Systems
Maintaining the right dew point is critical in heating, ventilation, and air conditioning systems. It ensures indoor air quality and prevents mold growth.
Agriculture
Farmers use dew point information to plan irrigation schedules and protect crops from frost or excessive moisture.
Sports and Outdoor Activities
Outdoor enthusiasts, athletes, and event planners use dew point data to determine optimal conditions for activities and minimize discomfort.
How to Calculate Dew Point Without a Chart
While a dew point chart is convenient, you can also calculate the dew point using a hygrometer or an online calculator. The formula involves:
Measuring the current temperature and relative humidity.
Using established equations or tools to derive the dew point temperature.
For those who enjoy DIY weather analysis, mastering this calculation can be an exciting skill.
Tips for Using Dew Point Data
- Monitor Seasonal Trends: Track how dew point levels change throughout the year to anticipate seasonal discomfort or hazards.
- Combine Metrics: Use dew point alongside other weather metrics, such as wind chill or heat index, for a comprehensive understanding of conditions.
- Invest in Tools: Consider purchasing a weather station or hygrometer for accurate local readings.
Conclusion
Decoding humidity with a dew point chart is an invaluable skill for weather enthusiasts, professionals, and anyone seeking greater comfort in their environment. By understanding the science behind dew points and how to interpret a chart, you can make informed decisions about your daily activities, health, and even business operations. Embrace the power of dew point data to navigate humidity with confidence and clarity.


